Kept & Counted

Methodology — the full recipe, nothing withheld

How we count.

Every number on the front page traces to a rule on this page, and every rule is printed with its actual threshold — not "our proprietary model," the real numbers the machine runs on. If we ever change a threshold, the change gets dated and the old reads stay up under the old rules. You should not have to trust us. You should be able to check us.

Step one

The universe — 1,590 names, chosen before we look at any of them

Every run reads the full S&P 500, S&P 400 (mid-cap), S&P 600 (small-cap) and Nasdaq 100 — about 1,517 names — plus roughly 73 off-index names (foreign ADRs, recent IPOs, and thematic names the index committees can't see yet). Constituent lists are pulled fresh from public sources each run.

What's deliberately excluded: the Russell 2000. The S&P small/mid indexes carry liquidity and viability screens; the Russell tail is untradeable microcap noise that makes breadth statistics look dramatic and means nothing. We'd rather count 1,590 real names than brag about 4,000.

The universe is fixed before the scan. Nothing gets added because it's exciting and nothing gets dropped because it's embarrassing.

Step two

Closed bars only — the unfinished week does not exist

The weekly read is computed on completed weekly bars. If the run happens on a Wednesday, this week's half-formed bar is discarded — a one-day-old "weekly" bar looks like a tight coil on almost everything.

Why we're strict about this: in testing, letting the in-progress week in produced 176 false setups in a single run. The rule exists because we watched it fail without it. The daily edition is the same engine on daily bars — that's the read that watches the current week develop.
ParameterWeekly editionDaily edition
Trend average40-week MA200-day MA
Normal volume8-week average20-day average
Base window26 weeks (6 mo)63 days (3 mo)
Box search3–12 weeks5–25 days
Big-mover bar (breadth)±7% / week±4% / day
Range floor5% / week3% / day
Liquidity floor$25M traded / week$5M traded / day

Step three

Who qualifies — three floors, one deliberate near-zero

Before any pattern is read, a name must clear three bars:

median weekly range ≥ 5% — a stock that doesn't move can't pay you for being right. This strips dead utilities and bond-proxies whose "coils" are just flat lines.

median $25M traded per week — you must be able to get in and out without being the market. This strips the untradeable small-cap tail.

6-month return ≥ 0% — and this one is the tell that we mean what we say about catching moves early. Most scanners demand big momentum, which guarantees you only ever see names that already ran. We only require the trend not be negative — being near the 52-week high with a rising 40-week average already proves the uptrend. The momentum bar stays on the floor on purpose.

Step four

Structure — the box, measured in the stock's own units

A coil is not "looks tight to me." It's a box with a tape measure:

The box — the longest run of 3 to 12 recent weeks whose entire high-to-low range fits inside 4.0 ATR. ATR is the stock's own average true range, so "tight" is judged in each name's native volatility — a 4-ATR box means the same thing on a sleepy insurer and a wild small-cap.

Pressed to the highs — the close must sit within 8% of the 52-week high. Coils in the middle of nowhere are not the pattern.

Not extended — close more than 8 ATR above the 40-week average is disqualified. That's the move everyone already sees; we don't chase it, we say so, and the daily lesson regularly shows one.

The trigger (SETUP vs COILING) — a name graduates from coiling to act-ready setup when this week's bar is an inside bar (higher low, lower high — the spring's last compression) sitting in the upper 40% of the box. Contraction is measured too: the recent half of the box ranging under 85% of the older half means the spring is still tightening.
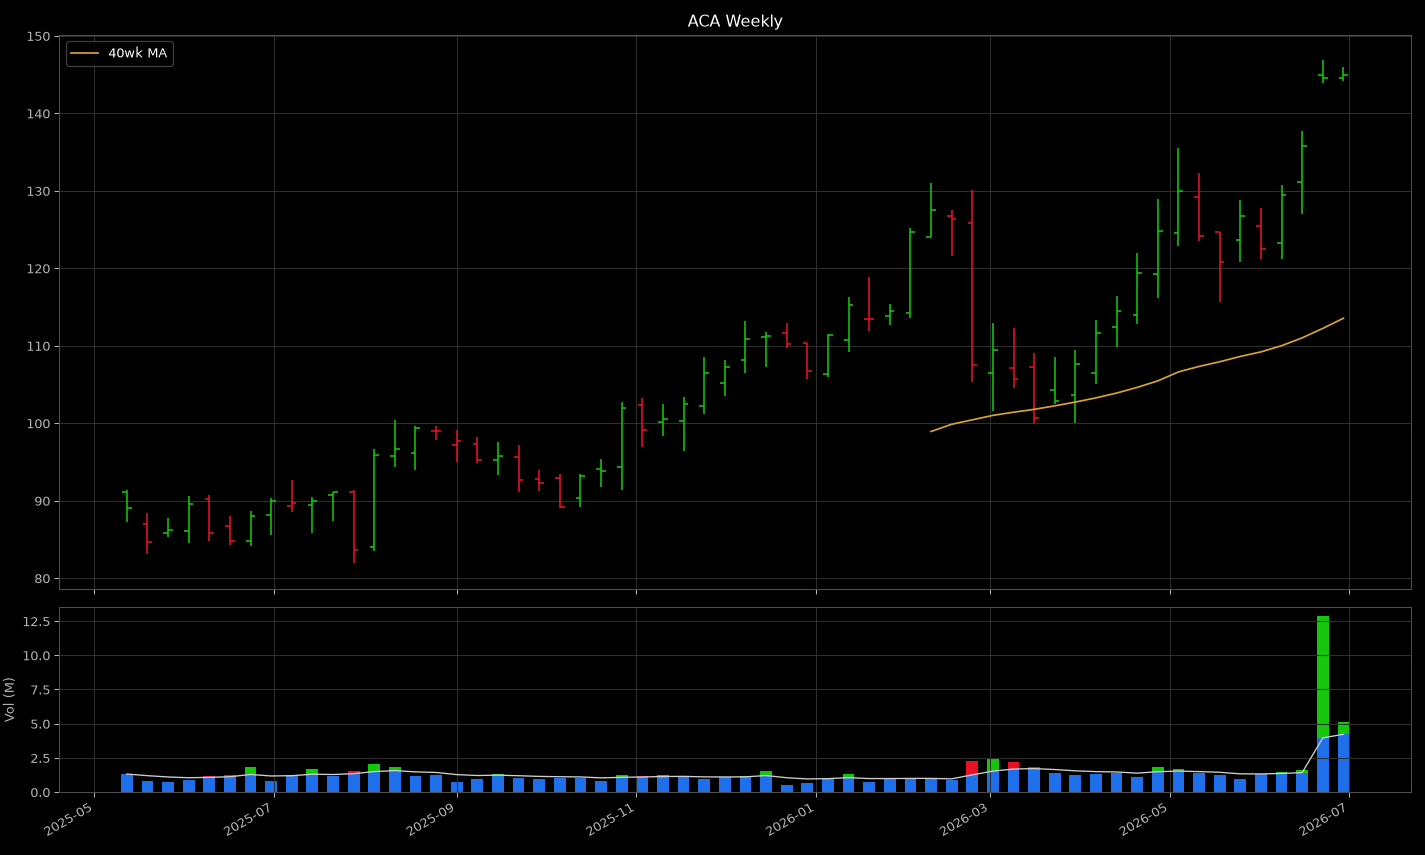
ACA weekly — machine render showing the box at highs and green volume caps beneath
A real one, from Saturday's read: ACA. Price coiled within 8% of its high, box under 4 ATR tall, inside-bar trigger at the box top — and beneath it, the reason structure alone is never enough: the caps.

Step five

Commitment — the caps, or who is actually in the box

Price tells you what happened. Volume tells you who was committed to it. Each week's volume is compared to the stock's own 8-week volume average:

The portion of the bar above that average is the cap — the excess effort that only shows up when institutions are active. The cap is green if the week closed up, red if it closed down. Everything below the average is base noise — ignored entirely.

Inside the box, the caps are tallied two ways: count (how many green vs red weeks — the 6G/0R notation on every card) and magnitude (how much excess, so one huge red week can't hide behind three tiny green ones).

The commitment rule, verbatim

Accumulation: green magnitude exceeds red by more than 15%, and green weeks are at least as many as red. Distribution: the mirror image. Anything else: neutral. No judgment calls, no exceptions — the same arithmetic for every name, every run.

Step six

The verdict — where structure meets commitment

Every coil gets exactly one of three words, assigned by rule:

COHERING — the caps read accumulation, price is above a rising 40-week average, and the box is either contracting or at least 5 weeks mature. Structure and commitment agree: the pause is being bought.

DIVERGING — the caps read distribution under a coil near the highs. Structure says coil, commitment says exit. This is the fake — and it goes on the front page with equal billing, because it's the chart most likely to take a newcomer's money.

MIXED — the components don't confirm each other yet. We say "not confirming" instead of manufacturing a lean that isn't there.

Step seven

Breadth — we count the army ourselves

None of the market-health numbers on the front page are imported from anyone. Three organs, all computed from the same 1,590 names:

Big-mover count — how many names moved ±7% this week (±4% on the daily read), up versus down. Three mega-caps can carry an index; they cannot fake a head-count.

T2108 — the percentage of all names above their own 40-week average. The market's internal temperature, and the timeframe-stable gatekeeper for the regime call.

The divergence check — a running cumulative line of (up movers − down movers), compared against the index itself. Index at new highs while the breadth line makes a lower high = leadership narrowing, the classic pre-top tell. When that fires, the front page says so and the gate tightens on its own.

304855 78▲ today 68
washoutweak healthyoverheated

Step eight

The regime and the gate — sticky on purpose, tested against real pain

The regime is a state machine with hysteresis, driven by T2108 (the thresholds on the scale above: 30 / 48 / 55 / 78) and the 5-week breadth thrust. "Sticky" means a wobble keeps the prior regime — only decisive evidence flips it. That costs a little speed and buys a lot fewer false alarms, and we'll take that trade every time.

How it was tested — against two years of real tape, not a story: it held CONFIRMED UPTREND through the late-2025 dips that recovered (no whipsaw), flipped to CORRECTION one week into the real March-2026 decline (−7.6%), and called WASHOUT at the April-2025 capitulation. Those flip dates are checkable in the archive as it grows.

The regime then gates the page. This is the exact policy table the machine runs:

RegimeGateLongs shownPage orderWhat it means
Confirmed uptrendopenup to 6longs lead Full hunt — wind at the back.
Neutral / choptightenedup to 5, decisive onlybalanced Only lopsided coils survive; thin and even reads are cut.
Overheated — rolling overfakes lead3, very decisivewarnings first Most coils near highs here are exits in disguise.
Correction / distributionheavily suppressed3, cleanest onlywarnings first Suppressed count printed. A learning tape, not a buying tape.
Washout / oversoldturn-watchup to 6, flaggedlongs, flagged Capitulation names are turn-watch, not chase-now — the page says so.

And just as important

What we refuse to use

Not because we couldn't. Because each of these is how a page starts lying to you:

Read this part twice

Where this can be wrong

The caps are an X-ray, not an oracle. They show who is committed now — they do not know the future. In our validation against archived charts, MU printed a neutral cap read and then ran roughly +56% anyway. The read was honest and the stock didn't care. That happens, and pretending otherwise would make everything else on this page worthless.

The regime lags by design. Hysteresis means we're deliberately about a week late to real turns in exchange for not flinching at every dip. You'll watch that trade-off play out in public.

The feed is imperfect. Prices come from a consumer data source; occasionally a name fails to download (one of 1,590 failed on Saturday's run) and the log says so. Counts can shift by a hair between runs.

The universe is a choice. Breadth computed on 1,590 liquid names is our definition of "the market." We think it's the right one — it is still a choice, and now you know exactly what it is.